Group Members : Sarah, Brittany, Samantha
Purpose
In this activity, you will work with a partner to select the appropriate tools to make metric measurements. You will collect the data needed to determine the averages for pod length, pod mass, and pod volume of two different species of plant pods. You will will then design you own data table, record the data, and generate appropriate graphs for communicating the data.
Materials
- Calculator
- Balance
- Beakers of various sizes
- Graduated cylinders of various sizes
- Forceps
- 6 Green Bean pods
- 6 Snow Pea pods
- Meter Stick
- Metric Ruler
Procedures
- Design a data table labeled Table 1. Your data table should include places to record the the length (mm) of 6 green bean pods, the mass (g) of 6 green bean pods, and the volume (cm^3) of 6 green bean pods. At the bottom of your data table record the average length, mass and volume, and record the class average length, mass and volume.
- Obtain 6 green bean pods and measure the length of the pods using a ruler and record this data in Table 1.
- Determine the average pod length for your sample and record this value in Table 1
- Create a new table called Table and repeat steps 1-3 but using 6 snow pea pods
- Next, weigh the 6 green bean pods on the scale and record this data in Table 1.
- Determine the average mass for your sample and record this value in Table 1.
- Repeat steps 5-6 but using 6 snow pea pods and record the data in Table 2
- Obtain a graduated cylinder and fill it up with water to 80 mL.
- Place your 6 green bean pods one at a time in the graduated cylinder and record how much the water level increases to find the volume (cm^3) of the pods. Then collect the volume data and record it in Table 1.
- Find the average volume of the green bean pods.
- Repeat steps 8-10 but using 6 snow pea pods and record the data in Table 2
- After collecting the average of the length, mass, and volume of the green bean pods and snow pea pods, share your averages with the class.
DATA
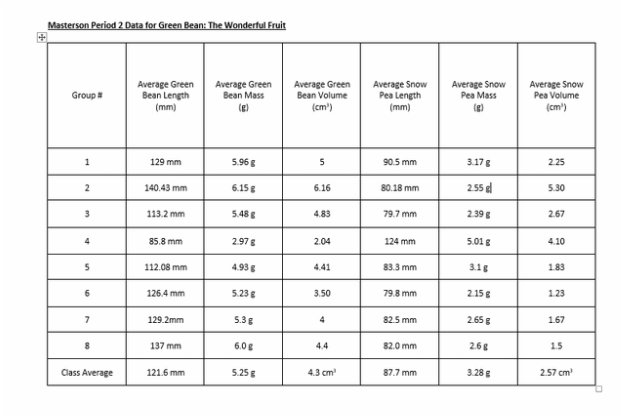
Average length, mass, and volume for the green bean pods and snow pea pods for each group and the class average.

Group 2's data and averages for the green bean pods.

Group 2's data and averages for the snow pea pods.
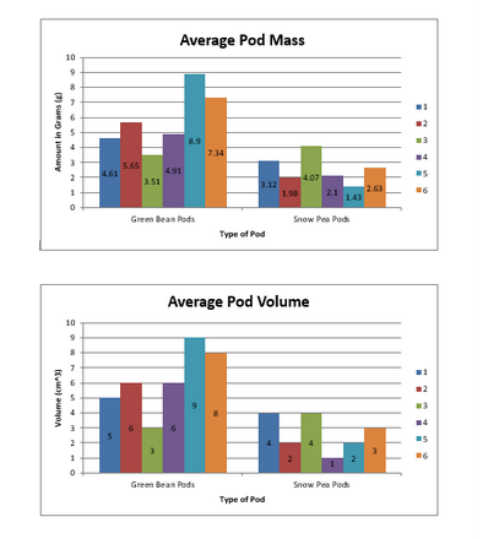
Trend: The mass and volume for both types of pods are very similar.
Analysis
The range of length variation for the green bean pods in group 2's sample is 29 mm. One can get this number by taking 149 mm and subtracting 120 mm. The range of length variation for the snow pea pods in group 2's sample is 22 mm. One can get this number by taking 95 mm and subtracting 73 mm. Group 2's green bean pod length average is 140.43 mm and the class average is 121.6 mm. Therefore, their average was larger by about 20 mm. This can be because group 2 had very tall green bean pods, which leads to a higher average within their group. Many other groups may not have had tall green bean pods which causes group 2 to be an outlier compared to the class average. Variation can be seen when comparing group 2's average volume for green bean pods and snow pea pods to the class average. Group 2's average volume for their green bean pods was 6.16 cm^3 and their average volume for their snow pea pods was 5.30 cm^3. The classes volume average for green bean pods was 4.3 cm^3 and the snow pea pods was 2.57 cm^3. Thus, group 2 was once again an outlier compared to the class average. The variation when comparing group 2's green bean pods and snow pea pods masses to the class average was the snow pea pods were less than the class average and the green bean pods were above the class average. The class average for mass for the green bean pods was 5.25 g and group 2's green bean pods weighed 6.15 g. The class average for mass for the snow pea pods was 3.28 g and group 2's snow pea pods weighed 2.55 g.
Conclusion
Group 2's green bean sample showed variation in mass, length, and volume. There is no variation in the green bean sample for length in group 2 because all the beans are around the same height which means that these beans are at a favorable height and have a better chance of survival then others. There is variation for mass because the more favorable green beans have breed with less favorable beans creating a set of green beans with different masses. For example, the highest mass is 8.90 g and the lowest is 3.51 g. Finally there is no variation in volume because the green beans are around the same volume, which means these beans have a trait for size. If a person was given an unidentified bean that was 115 mm long, one would predict this bean to be a green bean because the average size of a green bean is 121.6 mm. This means this unidentified bean is 6.6 mm away from the average. Therefore, one would believe this bean to be a green bean. If a person was randomly given a green bean of the same variety used in this activity, one would predict its mass to be around 5.25 g because that is the average green bean mass.
Bibliography
Green Beans, the Wonderful Fruit Using Scientific Measurement. (2011). Retrieved September 1, 2015, from www.ifitraing.org
